The AI Jobs Boom Is Data Center Jobs, Not Software
The Economist says AI created 1m US jobs. BLS data shows the four industries that build and sell AI lost 165,500 since ChatGPT launched. The gains are in construction.

Data journalist covering markets, platforms, and the economics of rating systems.
The Economist told its readers last week that artificial intelligence has already created about a million jobs in America, and that the long-promised jobs apocalypse has been postponed. The post carrying that claim has been seen close to a million times.
Our analysis suggests that AI has so far created around 1m new jobs in America. We explain how the technology has created a hiring boom
— The Economist (@TheEconomist) September 5, 2026
The claim is defensible. It is also, read against the underlying government series, close to the opposite of what most readers will assume it means. The million jobs are not being created in the industries that build and sell artificial intelligence. Those industries have shed workers. The jobs are being created by the concrete, steel, copper and switchgear that AI needs in order to run.
The industries that build AI have lost 165,500 jobs
Start with the Bureau of Labor Statistics establishment survey, which counts jobs by the industry of the employer. Take November 2022, the month ChatGPT was released, as the baseline, and read forward to the most recent published month, August 2026. Four industries cover the firms that design AI systems, manufacture the chips they run on, host them, and supply their electricity.
| Industry (thousands) | Nov 2022 | Aug 2026 | Change |
|---|---|---|---|
| Computer systems design | 2,482.9 | 2,362.7 | −120.2 |
| Computer & electronics mfg | 1,058.6 | 998.5 | −60.1 |
| Data processing & hosting | 483.0 | 453.3 | −29.7 |
| Utilities | 567.2 | 611.7 | +44.5 |
| Those four combined | 4,591.7 | 4,426.2 | −165.5 |
| Information sector | 3,115.0 | 2,745.0 | −370.0 |
| Construction | 7,863.0 | 8,359.0 | +496.0 |
| Specialty trade contractors | 5,001.9 | 5,276.7 | +274.8 |
| Total nonfarm | 154,242 | 159,075 | +4,833 |
The four American industries that build and sell artificial intelligence employed 165,500 fewer people in August 2026 than in November 2022, the month ChatGPT launched. Over the same period the whole economy added 4.83 million jobs.
Only one of the four is growing, and it is the least glamorous: utilities, up 44,500. Data processing and hosting, the industry code that actually contains the data center operators, added nothing on net. Computer systems design, the largest of the four and the industry most people picture when they picture an AI job, lost 120,200. The wider information sector, which contains software publishers and the big platforms, is down 370,000 over the same window.
Method note: figures are seasonally adjusted employment levels from the BLS Current Employment Statistics survey, series CES6054150001, CES3133400001, CES5051800001, CES4422000001, CES5000000001, CES2000000001, CES2023800001 and CES0000000001, pulled from the BLS public API on 9 September 2026. The window is fixed at November 2022 to August 2026 for every row.
Where the jobs went instead
Construction added 496,000 jobs over the same window, and specialty trade contractors, the electricians, pipefitters and steel erectors who wire and plumb a building, account for 274,800 of them. Utilities added another 44,500. That is a build-out, and it is the single largest identifiable pocket of net job creation adjacent to the AI economy.
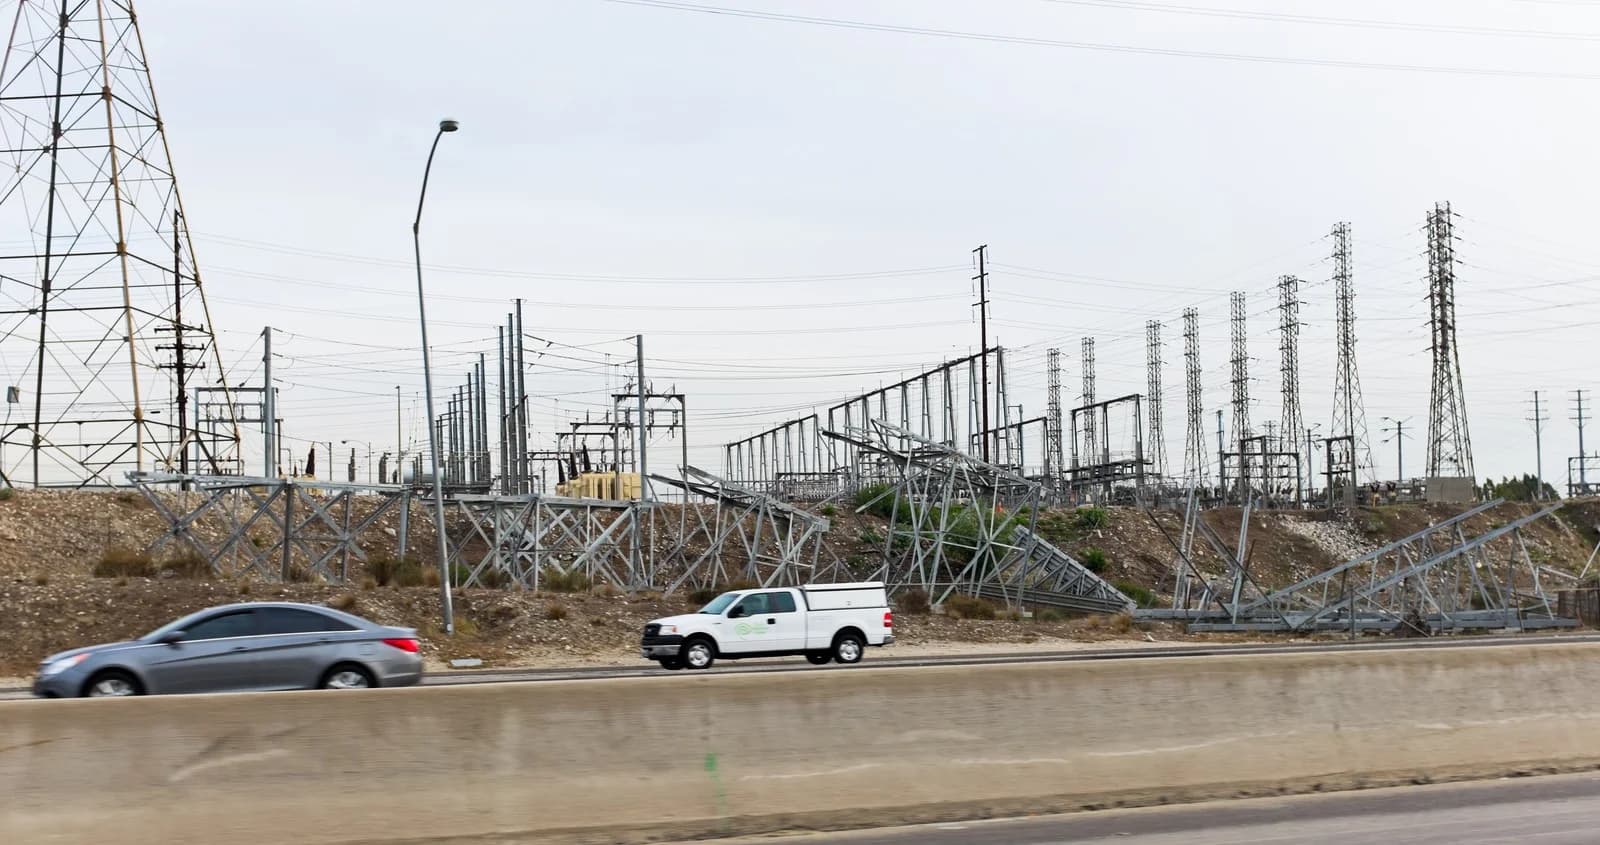
This is not a small technicality about industry codes. It is the shape of the boom. A data center in New Carlisle, Indiana or Abilene, Texas is, in employment terms, a very large electrical construction project attached to a very small permanent staff. The National Renewable Energy Laboratory's 2025 map of US data center infrastructure makes the point visually: the story is transmission lines and substations, drawn at national scale, with the compute itself reduced to dots.
An independent check: what employers are advertising
The BLS counts filled jobs. Indeed's Hiring Lab counts advertised ones, from a completely separate dataset, and it lets you compare the demand for desk work against the demand for physical work directly. Taking the same November 2022 baseline and reading to 4 September 2026, across all 47 sectors Indeed tracks, the pattern is unusually clean.

Source: Indeed Hiring Lab US job postings tracker (index, 1 February 2020 = 100). Method: percent change in each sector's index between 2022-11-01 and 2026-09-04, computed from the public sector-level dataset.
Every one of the seven desk-work categories most exposed to AI fell further than every one of the five physical build-out categories. There is no overlap between the two groups. Data and Analytics postings are down 58.8 percent, Software Development down 50.9 percent, Accounting down 49.5 percent. At the other end, Mechanical Engineering is down 10.8 percent, Electrical Engineering down 18.5 percent and Civil Engineering down 23.2 percent.
Two cautions. Postings across all 47 sectors are down, because the whole 2022 hiring market was extraordinary and unrepeatable, so the level of any single bar means less than its rank. And Indeed measures advertised openings, which respond faster than payrolls and overstate turning points in both directions. What survives both cautions is the ordering, and the ordering matches the BLS payroll data exactly: physical work is holding up better than digital work in the middle of a technology boom about digital work.
The leading indicator nobody quotes
There is a third series worth putting beside the other two, because it moves before payrolls do. Temporary help services employment fell from 3,036,700 in November 2022 to 2,519,500 in August 2026, a loss of 517,200 jobs and roughly 17 percent of the category. Staffing agencies are the shock absorber of white-collar demand: firms add temps before they add headcount and cut them before they cut staff, which is why the series usually turns a quarter or two ahead of the wider labour market.
It has now been falling for the better part of four years, through a period in which total employment rose by 4.83 million. Professional, scientific and technical services, the bucket that contains consultancies, law firms, accountancies and engineering practices, grew by only 183,300 over the same window, an increase of 1.7 percent against 3.1 percent for the economy as a whole. Neither series looks like a sector absorbing a million new AI jobs. Both look like sectors quietly running leaner.
That does not prove AI caused the shortfall. Interest rates, the unwinding of pandemic over-hiring and a broad correction in tech employment all landed in the same window, and disentangling them from a monthly series is not something any single chart can do. But it does mean the burden of proof sits with the optimistic reading. The industries where a knowledge-work boom would have to show up first are the ones showing the least sign of it.
So is The Economist wrong?
No, and the reconciliation matters more than the scoreboard. The Economist appears to be counting occupations and AI-attributable activity wherever they sit, not employers by industry code. On that basis an electrician wiring a hyperscale campus in Louisiana is an AI job. He is also, in the BLS data used above, a specialty trade contractor, indistinguishable from an electrician wiring a hospital. Both statements are true, and they produce very different headlines.
The honest version is the boring one: the AI jobs boom is real, and it is a construction boom wearing a software company's name. It is capital expenditure converting into hard hats, not intelligence converting into knowledge work. That distinction decides who benefits, where, and for how long. Electrical construction employment follows the capex cycle, and capex cycles end.
What the replies argued
Reaction to the post was thin on analysis and revealing anyway. The most-engaged text reply rejected the premise outright, arguing that the direction of travel is the one-person company, and that the point of making knowledge work cheap is to shrink headcount rather than expand it. That is a real theory, and the Indeed ranking is consistent with the first half of it: the desk sectors are where postings collapsed hardest. It is not consistent with the second half, because something has to explain 4.83 million net new jobs, and shrinking companies do not.
The rest of the replies were mostly reposted charts and cheerleading with no argument attached, which is itself a finding: a claim this consequential drew almost no serious public pushback in its own thread.
The test to watch
The two readings make a different prediction, and it is checkable within a year. If the boom is genuinely AI creating knowledge work, computer systems design and data processing employment should turn upward while the build-out continues. If it is capital expenditure, those two series stay flat and the construction and utilities gains fade the moment data center capex plateaus, leaving no permanent employment footprint behind. Watch CES6054150001 and CES5051800001. They have been the tell for four years, and so far they have said the same thing every month.